[reprinted and edited from 2012 and 2016 to cover House/Senate rather than electoral college]
Scientifically forecasting the presidential election has, in the span of just a few elections, gone from a hobby of some obscure political scientists to a full-blown mainstream media and public obsession. There are lots of forecasting sites out there for the midterm election, the most popular being FiveThirtyEight. And these sites are really popular; people love to read them!
And so I figure there are a lot of people out there who would like to do some amateur election modeling in the next week. And that’s one of the dirty little secrets of all this: the basic strategy is not wizardry. I’m not even remotely approaching a good modeler and/or quantitative forecaster. But that doesn’t mean I can’t try my hand at it. And the same thing applies to you.
There’s only one file you need to get started. Right-click and save this excel sheet (it’s about 2mb): 2018-monte-carlo-simulation-matt-glassman.
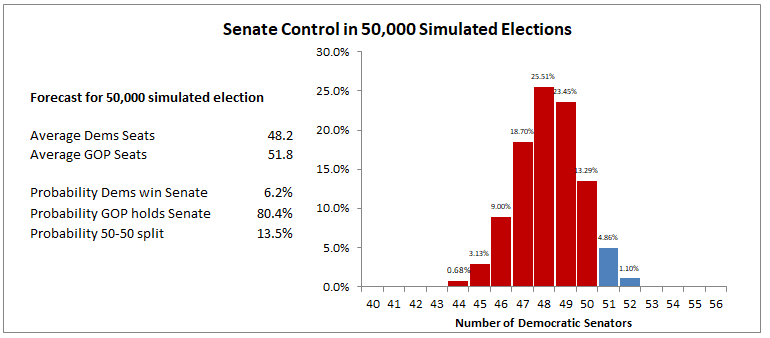
Open up the excel file. There are two sheets, one for the House and one for the Senate. I’ll focus on the Senate here. The top contains a list of all Senate races, and an associated probability of the Democratic candidate winning that state. The bottom contains summary statistics and a graphical plot of results.
Each time you alter any of the state win probabilities, the file re-runs a simulation of 50,000 elections, based on the individual state probabilities, and reports the following relevant national results: percentage of time the Dems and Republicans win control of the Senate; the percentrage of time the Senate is tied 50-50, the average number of seats for each party; and a graphical probability distribution of the Democrats’ number of seats. Excel will instantly re-run the simulation (it takes about 2 seconds on my crappy computer) any time you change any of the state win probabilities.
The graphic you see here is the distribution of outcomes when FiveThiryEight’s current (as of 10/31) “classic” win probabilities for each state are plugged into my simulation (not surprisingly, my sim and his sim both find the mean number of Democratic seats to be about 48.2; my sim’s estimate of the percent of the time the Dems control the House is lower — 6.1% to 14.8% — most likely because my sim is simple, non-dynamic, and doesn’t account for anything but the state win probabilities). But you can plug in whatever you want. It can be fun to get lost in the various scenarios. Trust me. If you are sure the Dems are going to win AZ, FL, and NV, you can plug in 100 for those numbers and rerun the sim. I just did that, and the Dem chances for chamber control inproved to 20%.
Now, let me be crystal clear about one thing: this is not a model of the election. The Monte Carlo simulation is the final step in translating your model into a forecast. Your actual model is the data and analytical process that generates the individual state win probabilities. When you waste a fun hour plugging in various different state probabilities, your implicit model is “my best guess.” In effect, you are just doing somewhat-systematic punditry. If you want to actually model the state probabilities, you need at a minimum some sort of data (if you just want to forecast) or some data and a theory (if you want to forecast and explain the Way Things Work).
Here’s an example of a super-simple forecast model: take the most recent major-firm poll in each state, get the Democrats’ percentage in the poll, build a table that translates each polling number to a win probability (i.e. polling 52% = 70% win chance; polling 58% = 99.99% win chance), and then just plug in the probabilities that your poll data suggests. Re-run simulation each time you get a new district-level poll.
Of course, that’s an absurdly simple and naive model. All sorts of advancements can be made on it. You can study the historical translation between poll numbers and win probabilities to improve your table; you can average multiple polls; you can weight those averages by the age of the poll and the past track-record of the pollster; you can correct for “house effects” of district-level polls; you can incorporate national polls and weight their contribution to the model; you can incorporate fundamental demographic data about the district; you can use all this to build a baseline and make the whole thing a continuous Bayesian update; you can build in uncertainty.
This sort of complicated and detailed modeling is exactly how the popular models work. Now, FiveThirtyEight’s model is proprietary, but other very good models, such as Votamatic, are fully transparent and available for inspection. Go check them out. It will demystify much of what is going on under the hood of these things. But the bottom line is that simple and complicated models all work the same way: use an algorithm to translate some data into win probabilities for each district, then simulate the elections with those probabilities.
Also note that the simulation I gave you here isn’t dynamic in any way. It’s the most basic simulation possible. In real life, if the Dems win the Tennessee Senate race — even if they only had a 25% estimated chance of doing so — they would almost certainly not lose in West Virginia. The simulator doesn’t account for this; the races are completely independent. Which isn’t how the world works. Making them partially dependent — forcing the simulator to have Democrats win WV if he happens to win TN, or having Republicans win ND if they happen to win MO — is an important complexity that many serious forecast models employ. This one does not.
And that’s the rub. Simple modeling and forecasting is very easy. Get some data, generate some win probabilities in the districts or states, and then simulate the election. Good modeling and accurate forecasting is much, much tougher. It requires careful theoretical and empirical specification, and a subtle understanding of how politics and public opinion work. You can read how the Votamatic model of the presidential election works here. Those aren’t chops I have, and they probably aren’t chops you have. But they certainly aren’t magical tools or skills that people are born with. And there is virtually zero barrier to entry to getting started. So why not?
At any rate, enjoy the Monte Carlo simulator — even seat-of-your-pants modeling of the win probabilities is a hell of a lot of fun! And if you want to get more into it, good luck. The sky’s the limit.
